
Matching RO Output Capacity to Filling Line Throughput: A Risk Check
Matching RO Output Capacity to Filling Line Throughput: A Risk Check
Conclusion: In a fully automatic bottled purified water filling line, the Reverse Osmosis (RO) system is not merely a purification unit; it is the primary flow regulator. If the RO daily output does not account for real-time filling throughput plus necessary buffer and loss factors, the line will experience pressure drops, inconsistent fill levels, or forced downtime. Procurement managers and operations leads must validate that the treatment capacity exceeds the peak filling rate by a calculated margin before commissioning.
The Hidden Bottleneck: Treatment vs. Filling Speed
When scaling up a production facility, a common risk is designing the filling line (e.g., a Bottled Purified Water Filling Line with capacities ranging from 200 to 2,500 bottles/hour) without synchronizing the upstream water treatment output.
Unlike spring water lines which may use NF+UF processes to retain minerals, purified water lines rely on a two-stage RO deep purification process. This process is sensitive to feed pressure and flow consistency. If the filling line demands water faster than the RO membranes can produce it—and if there is insufficient intermediate storage—the system faces two critical risks:
- Pressure Instability: Low feed pressure reduces RO rejection rates, compromising water quality (conductivity spikes).
- Flow Starvation: The filling valves cannot maintain constant head pressure, leading to under-filled bottles or air ingestion.
Key Factors in Capacity Matching
To avoid these bottlenecks, you must move beyond nominal "rated capacity" and evaluate the following operational realities:
1. Buffer Volume Calculation
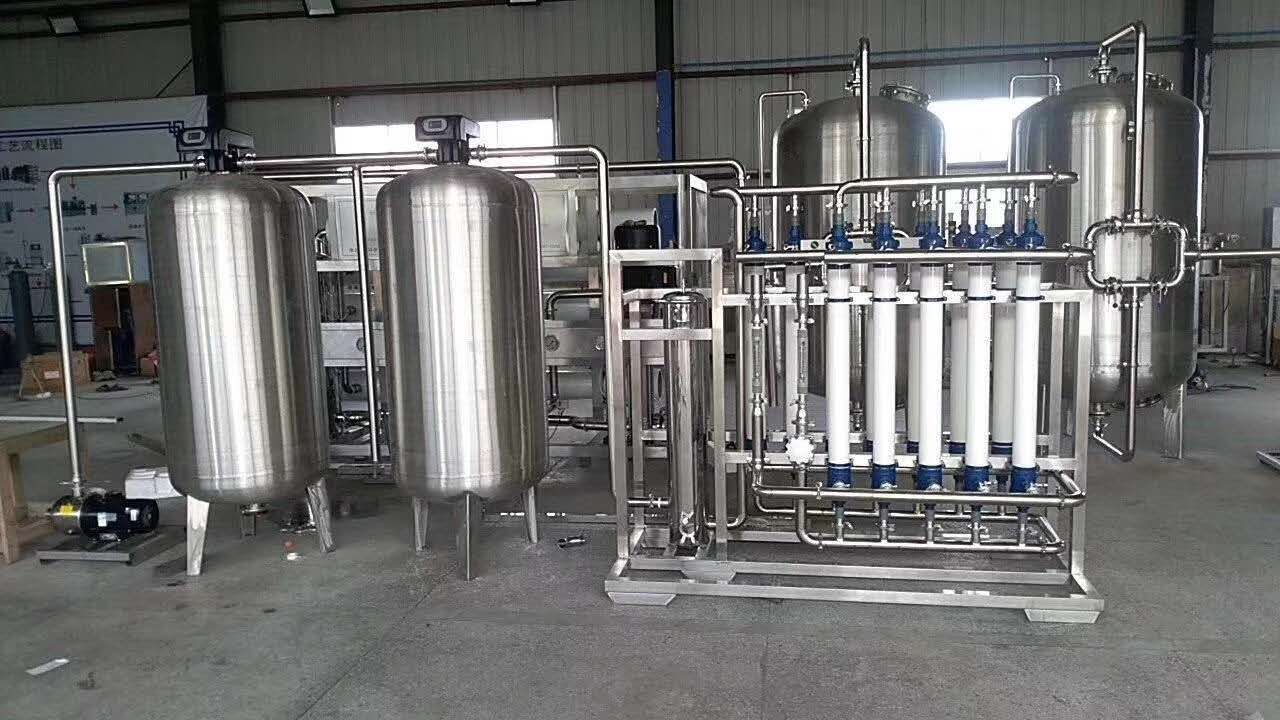
The RO system typically produces water continuously, while the filling line operates in cycles (washing, filling, capping). You need an adequate pure water storage tank to act as a buffer.
- Rule of Thumb:*
- Storage volume should support at least 30–60 minutes of peak filling line operation, independent of immediate RO production.
- Risk:*
- Insufficient buffer means any fluctuation in RO flux (due to temperature or membrane fouling) directly impacts filling accuracy.
2. Loss Factors and Yield Rate
RO systems do not convert all raw water into product water. There is a significant concentrate (waste) stream.
- Fact:*
- Depending on recovery rates, a portion of feed water is lost as concentrate.
- Implication:*
- Your raw water supply and pre-treatment capacity must match the feed requirement, not just the product output. If your raw water pump is undersized relative to the RO feed demand, the system will starve regardless of membrane area.
3. Peak vs. Average Throughput
A Bottled Purified Water Filling Line rated at 2,500 bottles/hour (for 5L/18.9L containers) likely has peak instantaneous demands higher than its average rating due to synchronized washing and filling phases.
- Check:*
- Ensure the RO system’s continuous output exceeds the peak hourly demand of the filling line, not just the theoretical maximum.
Implementation Boundaries and Verification
When reviewing technical proposals or engineering drawings, verify these specific boundaries:
- Pump Synchronization:*
- Confirm that the high-pressure RO pump and the filling line’s suction pumps are interlocked or balanced to prevent vacuum conditions in the pure water tank.
- Sanitary Design:*
- For purified water, the storage tank and distribution loop must support ozone and UV (254 nm) dual sterilization to prevent biofilm growth during low-flow periods. If the line runs slow but the water sits stagnant, quality degrades.
- CIP Compatibility:*
- Ensure the RO skid includes proper Clean-In-Place (CIP) connections. Without valid CIP coverage, membrane fouling will accelerate, reducing effective output over time.
Next Steps for Validation
Before finalizing equipment selection or site layout:
- Audit Current Water Quality: Source water characteristics dictate the required pre-treatment intensity and RO recovery rate.
- Calculate Total Daily Demand: Include filling volume, cleaning water usage, and CIP cycles.
- Request a Mass Balance Diagram: Ask your supplier to provide a detailed mass balance showing raw water input, concentrate output, product yield, and buffer requirements for your specific bottle sizes (5L, 11.3L, 18.9L).
Chuxin Mingwei designs custom solutions based on actual source water quality and target standards. We prioritize stability, applicability, and long-term maintainability in every engineering service.
Contact our engineering team to review your capacity matching calculations and ensure a seamless integration between your water treatment and filling systems.
Recommended
Bottled Spring Water Filling Production Line
Chuxin Mingwei’s customized bottled spring water filling production line is specifically...
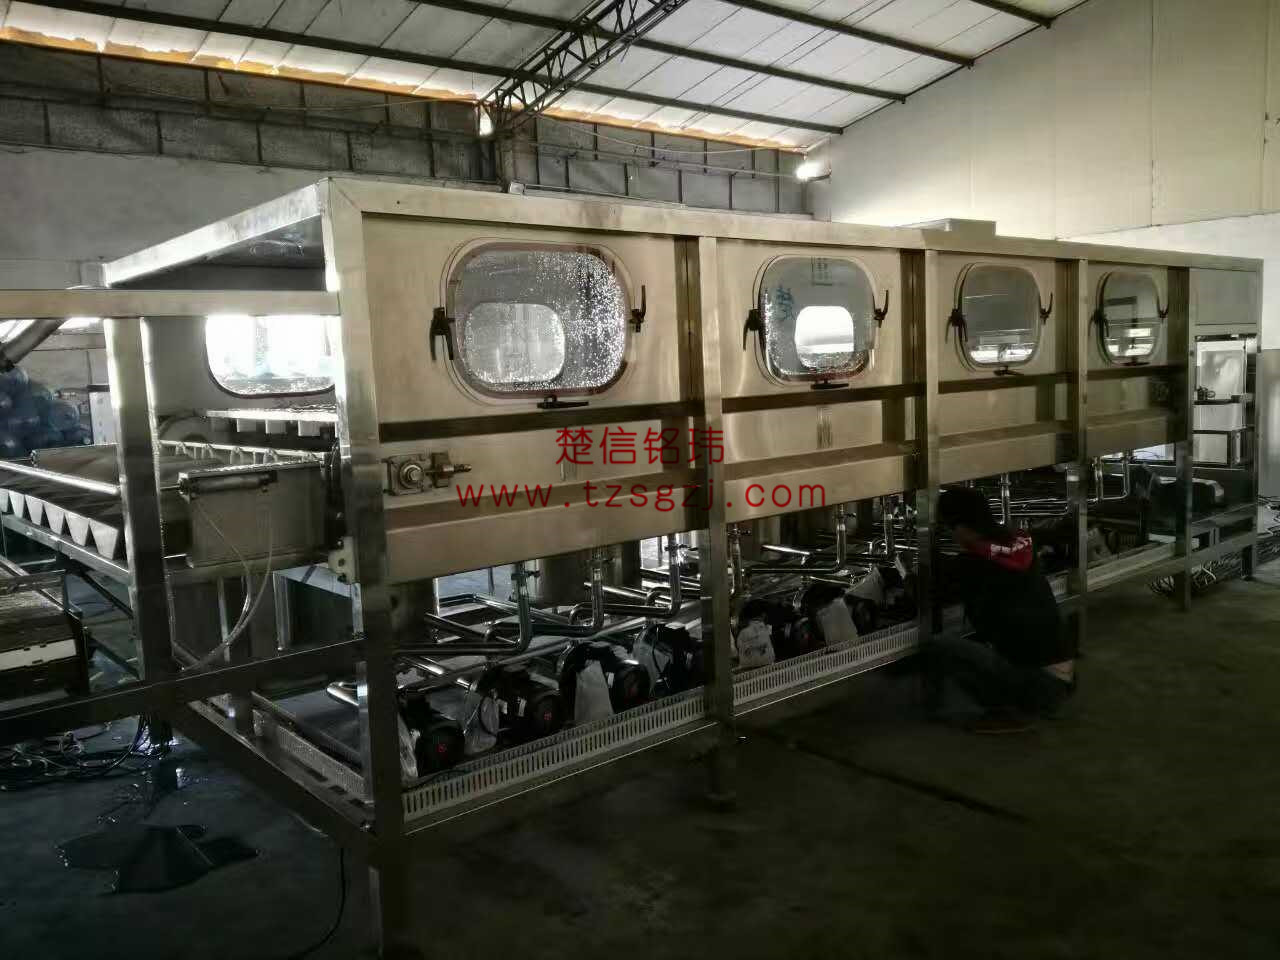
Fully Automatic Bottled Purified Water Filling Production Line
Chuxin Mingwei’s customized fully automatic bottled purified water filling production li...
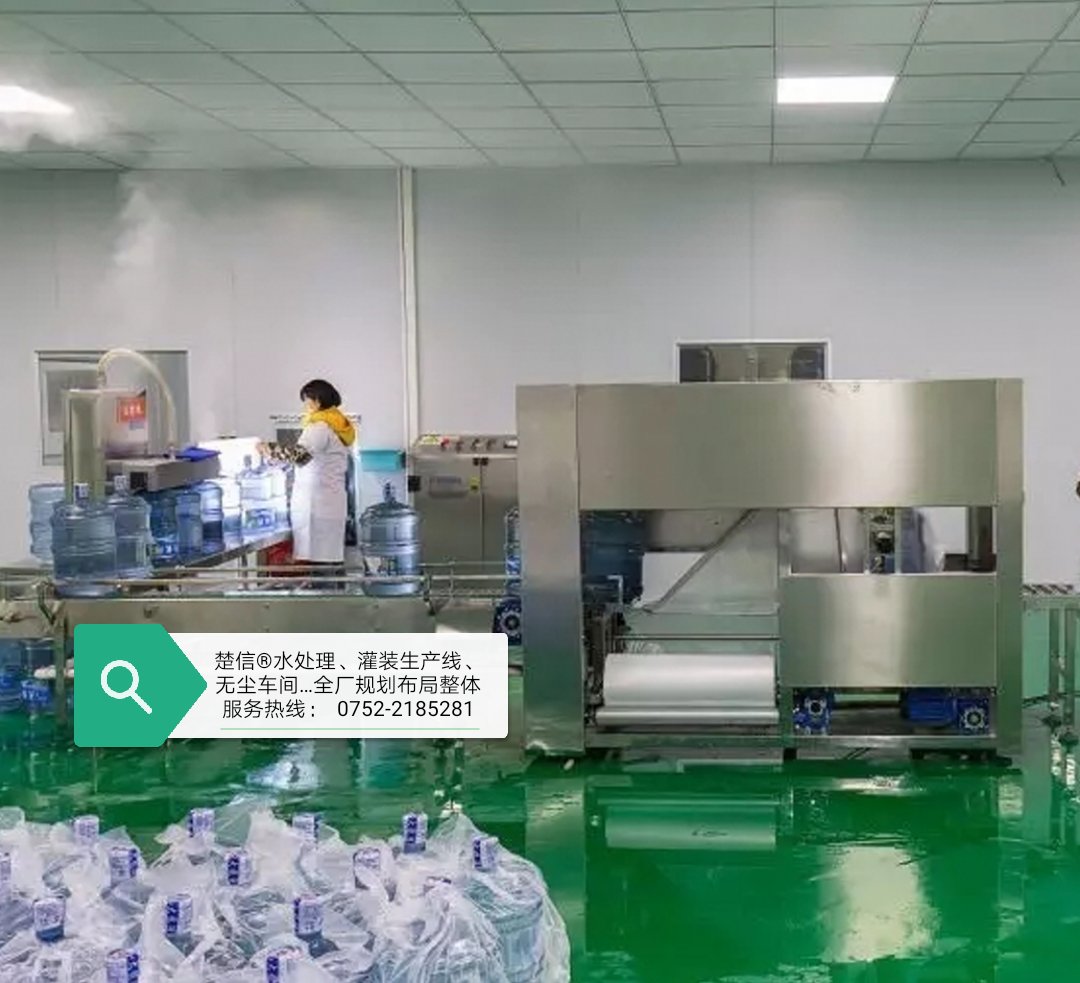
Clean Air Purification Systems
Custom-engineered air purification systems for water bottling and barrelled water fillin...